I’m a big fan of Colleen Dilenschneider’s blog. Her focus is on cultural organizations (museums, theaters, etc.) and she writes in depth about audience engagement, demographic trends, marketing, social media and much more. What’s great about her posts is that everything is driven by deep DATA. She works for IMPACTS – a global leader in predictive market intelligence and related technologies that allows her to share some of their findings with the public.
Her post about mobile apps and cultural institutions is a great example of how good data helps you really see through the opinion, hearsay, and trends to the real info. The article is self-explanatory but I’m going to borrow from one key element that I think any marketing director at a museum of cultural organization should print out and paste up on the wall.
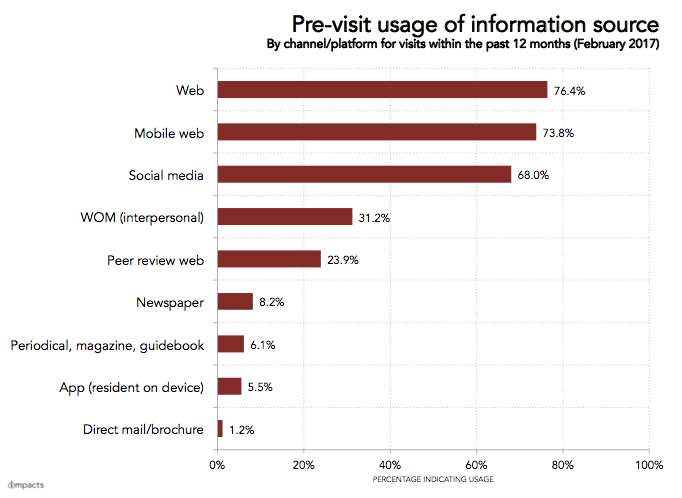
This chart is based on 108,000 surveyed respondents – which is one heck of a deep pool. The main point of this chart is this – your website matters. As does your social media – but look at the facts here – 3/4 of the respondents are going to your website first for answers.
In designing, maintaining and building many, many sites for cultural organizations over the last two decades we at Studio Two are privileged to seeing a lot of analytics data around website user behavior – what do people do when they go to your website? I’ve gone on record for a long time that the #1 most visited page on a museum’s website (after the home page) is the “visit” page, or the “hours, admissions and directions” page. On average, some 70-80% of traffic goes to that page first – and often ONLY to that page. People need facts – when are you open? How much is a ticket? Where are you located?
Colleen’s stats and my analytics should be a wakeup call to any organization that is dragging its feet on upgrading their website to be responsive – a mobile-unfriendly site is hurting your attendance. In addition, take a look at your site from the position of that 75% visitor – is it quick and easy to find the answers about when you are open and how to find you? If not, that needs to be fixed.
In addition, I think that this information is a great tool for looking at how to allocate resources to marketing materials, media and outreach. If you are spending a larger percentage of your budget on designing, printing and mailing brochures than you are on maintaining, optimizing and modernizing your website annually – well, there’s a good chance you are not reaching people where they prefer to find their answers. Look at the data – and make the logical decision.